1. integrate函数
myfun=function(x){x}
result <- integrate(myfun,0,1)
#结果不是数值格式,需通过$value取值
result <- result$value
2. 举例
2.1 分段函数求积分
分段函数的参数有11组,在每组参数下求出分段函数的积分值。
| p1 | p2 | c1 | c2 | s | v | l | m | n | q |
|---|---|---|---|---|---|---|---|---|---|
| 5 | 2 | 3 | 4 | 6 | 1 | 10 | 30 | 50 | 50 |
| 4 | 2 | 3 | 4 | 6 | 1 | 10 | 30 | 50 | 47.78 |
| 5 | 1 | 3 | 4 | 6 | 1 | 10 | 30 | 50 | 53 |
| 5 | 2 | 2 | 4 | 6 | 1 | 10 | 30 | 50 | 60 |
| 5 | 2 | 3 | 3 | 6 | 1 | 10 | 30 | 50 | 49 |
| 5 | 2 | 3 | 4 | 8 | 1 | 10 | 30 | 50 | 53.33 |
| 5 | 2 | 3 | 4 | 6 | 0 | 10 | 30 | 50 | 40.91 |
| 5 | 2 | 3 | 4 | 6 | 1 | 0 | 30 | 50 | 54 |
| 5 | 2 | 3 | 4 | 6 | 1 | 10 | 20 | 50 | 57 |
| 5 | 2 | 3 | 4 | 6 | 1 | 10 | 30 | 40 | 51 |
| 5 | 2 | 3 | 0 | 6 | 1 | 0 | 0 | 50 | 75 |
setwd("/Users/yuejeevan/documents/Rproject/math")
xx <- read.csv('data.csv',header = TRUE,sep=",")
yy <- array(1:11)
for(nn in 1:11){
attach(xx[nn,])
f1=function(x){
  (p1*x+p2*n-c1*q+v*(q-x-n))/100
}
y1 <- integrate(f1,0,q-n)
y1 <- y1$value

f2=function(x){
  (p1*x+p2*(q-x)-c1*q)/100
}
y2 <- integrate(f2,q-n,q)
y2 <- y2$value

f3=function(x){
  (p1*x+p2*(q+l-x)-c1*q-c2*l)/100
}
y3 <- integrate(f3,q,q+l)
y3 <- y3$value

f4=function(x){
  (p1*x-c1*q-c2*(x-q))/100
}
y4 <- integrate(f4,q+l,q+m)
y4 <- y4$value

f5=function(x){
  (p1*(q+m)-c1*q-c2*m-s*(x-q-m))/100
}
y5 <- integrate(f1,q+m,100)
y5 <- y5$value

mysum <- y1+y2+y3+y4+y5
yy[nn] <- mysum
detach(xx[nn,])
}
yy
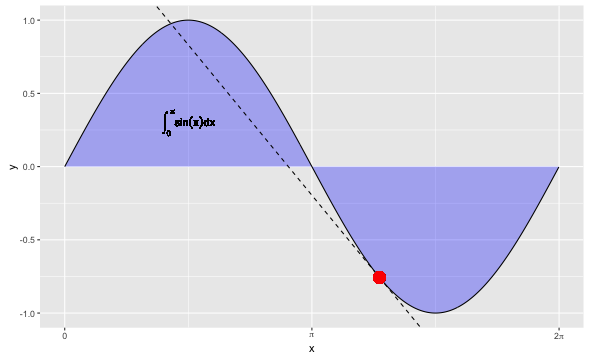
2.2 sin(x)在x=4处的导数,在0到pi之间的曲线下面积
#2.2.1 用D运算子得到符号运算结果,然后代入数值即可得到导数
dx <- D(expression(sin(x)),'x')
x <- 4
slope <- eval(dx)
#2.2.2 方法一:用integrate函数直接求出数值积分
integrate(function(x) sin(x),0,pi)
#2.2.3 采用蒙特卡罗仿真,得到的结果相当接近
x <- runif(1000000,min=0,max=pi)
y <- runif(1000000)
pi*sum(y<sin(x))/1000000
#2.2.4 用ggplot2绘制上面的图形,代码如下:
library(ggplot2)
intercept <- sin(4)-slope*4
x <- seq(from=0,to=2*pi,by=0.01)
y <- sin(x)
p <- ggplot(data.frame(x,y),aes(x,y))
p + geom_area(fill=alpha('blue',0.3)) +
  geom_abline(intercept=intercept,slope=slope,linetype=2) +
  scale_x_continuous(breaks=c(0,pi,2*pi),labels=c('0',expression(pi),expression(2*pi))) +
  geom_text(parse=T,aes(x=pi/2,y=0.3,label='integral(sin(x)*dx, 0, pi)')) +
  geom_line() +
  geom_point(aes(x=4,y=sin(4)),size=5,colour=alpha('red',0.5))

Rplot